所屬科目:研究所、轉學考(插大)-資料結構
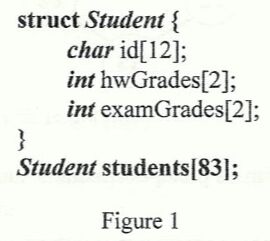
1. Figure 1 shows the Student structure. The students array starts at memory address 200. An int uses 4 bytes of memory, and a char uses 1 byte. Find the memory address of students[10].hwGrades[1]. Assume memory addresses are written in decimal and array indexing begins at 0. (10%)
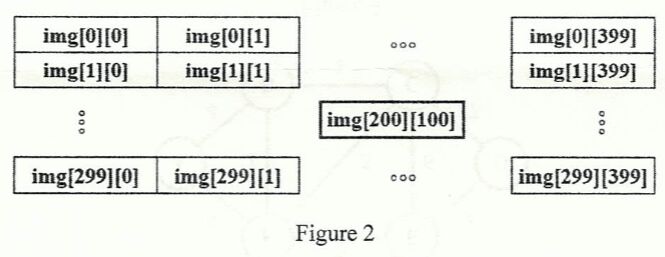
2. Figure 2 shows an image stored in a two-dimensional array img[row][column] using row-major order. The array starts at memory address 30000. The image has 300 rows and 400 columns, and each pixel uses 4 bytes of memory. What is the memory address of img[200][100]? Assume that memory addresses are written in decimal and array indices start from 0. (10%)
3. Convert the following infix expression to postfix notation: (10%) $$(P + Q - R) \times (A - B)$$
4. A binary search tree (BST) can be uniquely reconstructed from its postorder traversal. Draw the BST that corresponds to the following postorder traversal sequence: (10%) $$A \rightarrow C \rightarrow B \rightarrow E \rightarrow G \rightarrow F \rightarrow D \rightarrow H$$
5. Build a max heap by inserting the following elements one by one into an empty heap: 10, 14, 33, 27, 35, 19, 42. Show the state of the heap after each insertion step. (10%)
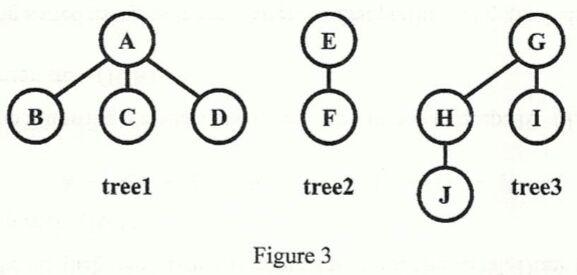
7. Using the left-child right-sibling method, change the forest in Figure 3 into one binary tree. (10%)
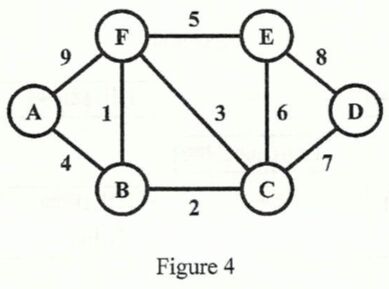
8. Use Kruskal's algorithm to find the minimum cost spanning tree (MCST) of the graph in Figure 4. Show your work step by step and draw the graph at each step. (10%)
(a) Insertion sort works best when the input list is already sorted in increasing order, and the target sequence is also in increasing order.
(b) If average-case time complexity is the most important factor, quick sort is a good choice.
(c) If worst-case time complexity is important, heap sort and merge sort are better choices than quick sort.
(d) Quick sort is not a stable sorting algorithm.
(e) The lower bound of time complexity for any comparison-based sorting algorithm is \( \Omega (\mathfrak{n}\log \mathfrak{n}) \)
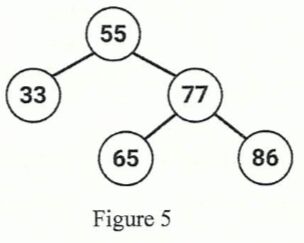
10. Insert the key 57 into the AVL tree shown in Figure 5. (10%)
 阿摩線上測驗
登入