阿摩線上測驗
23. Refer to Figure 7. Assume the figure charts possible outcomes for the year 2019. In 2019, the economy is at point A on the left-hand graph, which corresponds to point A on the right-hand graph. The price level in the year 2018 was
Figure 7. The left-hand graph shows a short-run aggregate-supply (SRAS) curve and two aggregate-demand (AD) curves. On the left-hand diagram, Y represents output and on the right-hand diagram, U represents the unemployment rate. 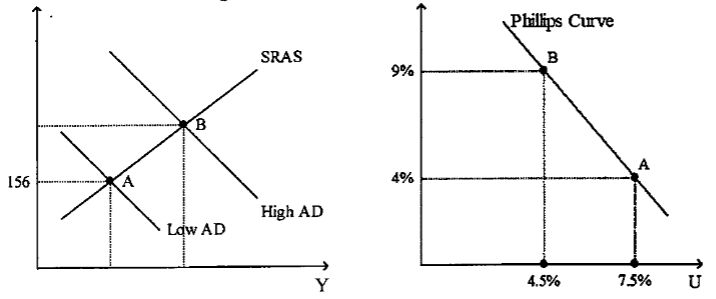
(A) 144.
(B) 150.
(C) 152.
(D) 156.
答案:登入後查看
統計: 尚無統計資料
統計: 尚無統計資料