所屬科目:研究所、轉學考(插大)◆統計學
1. Random variable (5%)
2. Central limit theorem (5%)
3. Degree of freedom (5%)
4. Type I error (5%)
1. Construct a stem-and-leaf plot. Is the distribution symmetric, positively skewed, negatively skewed, or binomial? (10%)
2. Find the sample mean, median and mode. (10%)
3. Construct a boxplot. (5%)
4. Compute the sample variance and the standard deviation. (5%)
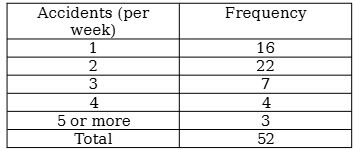
三、 The data on frequency distribution of accidents at a certain intersection in Chiayi City were recorded as the following table. Based on this frequency table, can we conclude that the true distribution of accident frequency distribution is Poisson with λ=2? A 0.05 significance level has been selected. (20%)
1. Examine the scatter plot. Does there appear to be a linear trend in the data? (5%)
Calculate and <strong>interpret</strong> the least square estimates of \( \beta_0 \) and \( \beta_1 \) for the linear model \( y = \beta_0 + \beta_1x + \varepsilon \). (10%)
3. Predict the number of sales for a month with 30 ads. (5%)
4. Calculate and interpret the value of r2 for this data set. (5%)
5. If y and x were reversed in the above regression, what would you expect r2 to be? (5%)
 阿摩線上測驗
登入
阿摩線上測驗
登入