所屬科目:研究所、轉學考(插大)◆統計學
(1-A) What is the meaning of "return to the mean"? (4%)
(1-B) What is "nonparametric statistics"? (4%)
(1-C) What is "simple random sampling"? (4%)
(2-A) the population is normal and n is small? (3%)
(2-B) the population is normal and n is large? (3%)
(2-C) the population is not normal but the departure from normality is not marked and n is small? (3%)
(2-D) the population is not normal and n is large? (3%)
(3-A) (6%) The number of customers who visit a car dealer's showroom on a Saturday morning is a random variable with µ=18 and σ=2.5. With what probability can we assert that there will be more than 8 but fewer than 28 customers?
(3-B) (6%) Prove that for the Poisson distribution (λ is the mean value of random variable)for x = 0, 1, 2, ......
(3-C) (6%) Find k so that the following can serve as the probability density of a random variable:
(3-D) (6%) Let the n random variables X1, X2, ..., Xnbe independent and each have the same distribution with mean µ and variance σ2. Show that σ2is the mean of the sample variance
(3-E) (6%) A random sample of 300 shoppers at a supermarket includes 204 who regularly use cents-off coupons. Construct a 98% confidence interval for the probability that any one shopper at the supermarket, selected at random, will regular use cents-off coupons.
(4-A) Plot the estimated regression function. Would it be reasonable to use this regression function for swimmers of age 40? Comment. (4%)
(4-B) Construct a 95% confidence interval for the curvature effect coefficient. Interpret the confidence interval? (4%)
(4-C) Test whether the curvature effect can be dropped from the quadrant regression model,controlling the α risk at 0.05. State the alternatives, the decision rule, the value of the test statistic, and the conclusion. What is the P-value of the test? (10%)
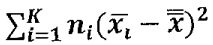
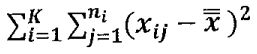
5. (12%) Suppose that we have independent random samples of n₁, n₂,..., nₖ observations from K population. Denote by..., the K group sample means and by the overall sample mean. We define the following sums of squares:Within group sum of squares (SSW) =Between groups sum of squares (SSG) =Total sum of squares (SST) = where Xᵢⱼ denotes the jᵗʰ sample observation in the iᵗʰ group. Please show the followingrelationshipSST = SSW + SSG
(6-A)Test whether opinion and gender of viewer are independent, controlling the α risk at 0.10. State the alternatives, the decision rule, the value of test statistic, and the conclusion. (12%)
(6-B) Given the conclusion is part (6-A), should the next step be to examine the relative squared residuals for the test? Explain. (4%)
 阿摩線上測驗
登入
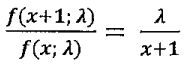 for x = 0, 1, 2, ......
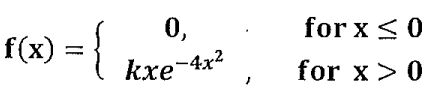

 ...,
 the K group sample means and by
 the overall sample mean. We define the following sums of squares: