所屬科目:研究所、轉學考(插大)◆統計學
1. A certain HMO is attempting to show the benefits of managed care to an insurance company.T he H MO believes that certain types of doctors are more cost-effective than others. One theory is that certi fication level is an important factor in measuring the cost-effectiveness of physicians. To investigate this, the HMO obtained independent random samples of 26 physicians from each of the three cer tification levels-- Board certified ( C ); Uncertified, board eligible ( E ); and Uncertified, board ineligible (l)-and recorded the total per-mem ber, per-month charges for each (a total of 26 physicians). In order to compare the mean charges for the three groups, the data will be subjected to an analysis of variance. Write the null hypothesis tested by the ANOVA. (A) H0, μC =μE=μI=O (B) H0: μC = μE =μI (C) H0:β1= β2=β3=0 (D) H0: p1= p2 = p3
2.Suppose a Poisson probability distribution with = 7 6 provides a good approximation of the distribution of a rndom variable x. Find σ for x. (A)57.76(B)3,8 (C)7.6(D)
3. A teacher finds that final grad es in the statistics department are distributed as: A, 25%; B, 25%; C, 40%; D, 5%; F, 5%. At the end of a randomly selected semester, the following grades were recorded, Calculate the chi-square test statistic X2 used to determine if the grade distribution for the departrnent is different than expected. Use a = 0.01.(A)4.82 (B)6.87 (C)3.41 (D)5.25
4. The dean of the Business School at a smal Florida college wishes to determine whether the grade-point average (GPA) of a graduating student can be used to predict the graduate's starting salary. More specifically, the dean wants to know Whether higher GPAs lead to higher starting salaries, Records for 23 of last year's Business School graduates are selected at random, and data on GPA (x) and stating salary (y, in $thousands) for each graduate were used to fit the mode! The results of the simple linear regression are provided below,Calculate the value of r2, the coefficient of determination. (A)0.339 (B) 0.661 (C)0.934 (D)0.872
5.A random sample of 160 car accidents are selected and categorized by the age of the driver determined to be at fault. The results are listed below. The age distribution of drivers for the given categories is 18% for the under 26 group, 39% for the 26~45 group, 31% for the 45-65 group, and 12% for the group over 65. Calculate the chi-square test statistic X used to test the claim that all ages have crash rates proportional to their driving rates. (A) 75.101 (B) 85.123 (C) 95.431 (D) 101.324
6.Independent tandom samples were selected from each of two normally distribu ted populations, from population I and from population 2. The data are shown below. Population1: 25 3.1 2.3 18 4.2 35 39 Population2: 2.9 17 4.6 3.5 37 28 4.6 3.4 1.9 Find the test statistic for the test of (A) 1.17 (B).735(C)1.36 (D)857
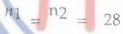
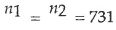
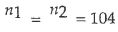
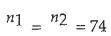
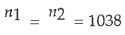
7.A consumer protection agency is com paring he work of two electrical contractors. The agency plans to inspect residences in which each of these contractors has done the wiring in order to estimate the d ifference in the proportions of residences that are electrically deficient. Suppose the proportions of residences with deficient work are expected to be about . 2 for both contractors. How many homes should be sampled in order to estimate the difference in proportions using a 90% confidence interval of width . 5? )”(A)(B) (C) (D)
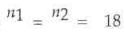
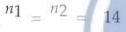
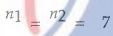
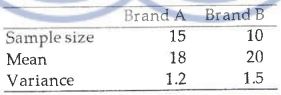
8. The FDA is comparing the mean ea feine contents of two brands of cola. Independent random samples of 6-oz. cans of Heach brand were selected and the caffeine content of each can determined. The study provided the following summary information. Brand A Brand B Sample size 20 Variance 1.2 How many cans of each soda would need to be sampled in order to estimate the difference in the mean caffeine content to within 10 with 90% reliability? (A)(B)(C) (D)
10. Event A occurs with probability 0.3. If event A and B are disjoint then (A)(B)(C)(D)
11. A manufacturer receives parts from two suppliers. An SRS of 400 parts from supplier I finds 20 defective. An SRS of 100 parts from supplier 2 finds 10 defective. Let pt and po be the proportion of all parts from suppliers I and 2, respectively, that are defective. A 95% confidence interval for p1 - p2is (A) -.056±0.068.
(B) -.056±0.054.(C) -.056±0.033.(D) .056 ±0.033.
18. To assess the accuracy of a laboratory scale, a standard weight that is known to weigh 1 gram is repeatedly weighed a total of n times and the mean of the weighings is computed. Suppose the scale readings are normally distributed with unknown mean and standard deviation =0.01 g. How large should : be so that a 95% confidence interval for has a margin of error of±0.0001? (A) 100(B)196(C)10000(D) 38416
 阿摩線上測驗
登入

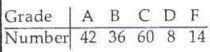 (A)4.82 (B)6.87 (C)3.41 (D)5.25
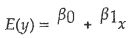 The results of the simple linear regression are provided below,
 Calculate the value of r2, the coefficient of determination. (A)0.339 (B) 0.661 (C)0.934 (D)0.872
 (A) 75.101 (B) 85.123 (C) 95.431 (D) 101.324
 from population
I and
 from population 2. The data are shown below.
 (A) 1.17 (B).735(C)1.36 (D)857
 (B)
 (C)
 (D)
 (A)
 (B)
 (C)
 (D)
 (B)
 (C)
 (D)

 of the weighings is computed.
Suppose the scale readings are normally distributed with unknown mean and standard
deviation =0.01 g. How large should : be so that a 95% confidence interval for has a
margin of error of±0.0001?
(A) 100(B)196(C)10000(D) 38416