所屬科目:奧林匹亞地理
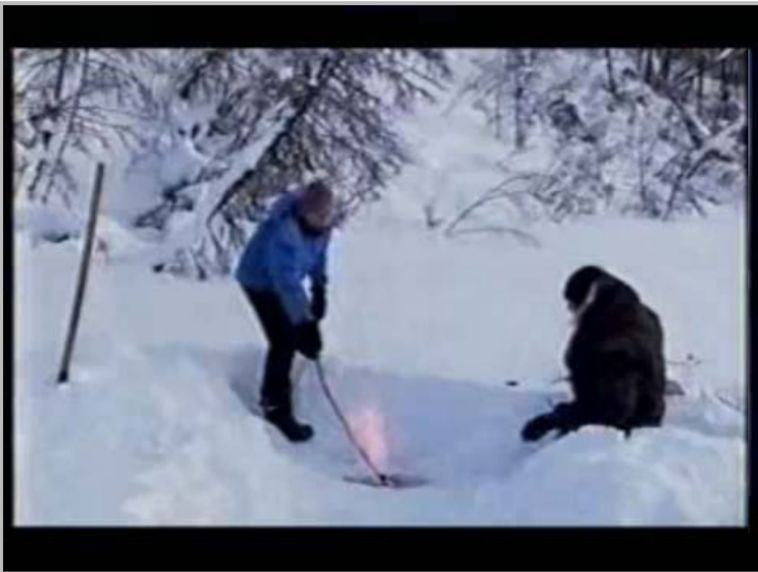
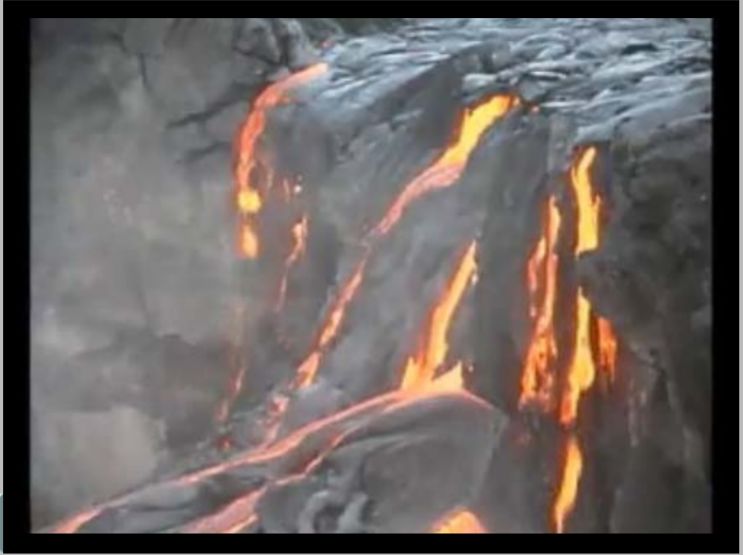
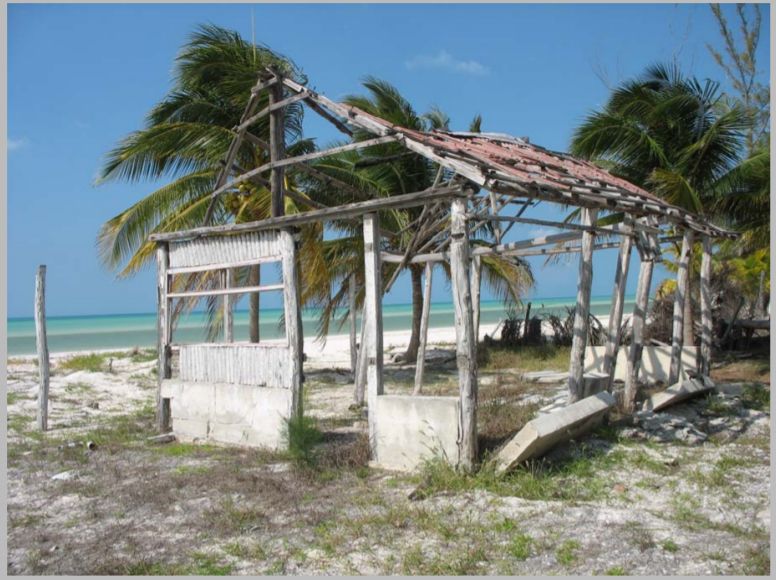
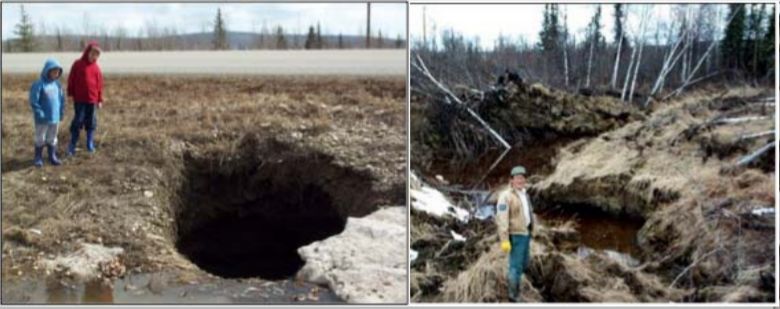
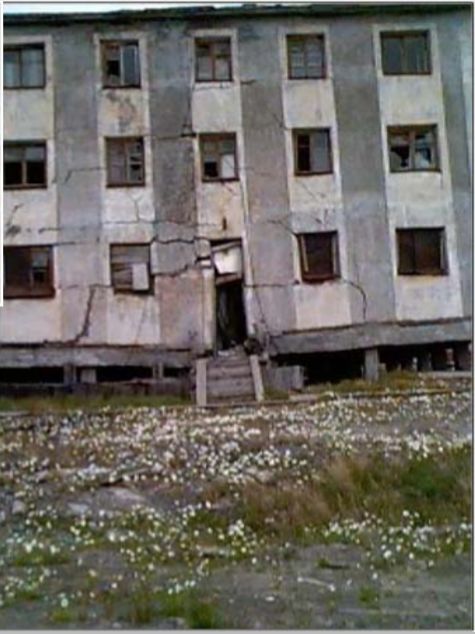
1. These three photographs were all taken in the same country. Look carefully. In which country were they taken?(A)Sweden(B)Greece(C)Egypt(D)Costa Rica
2. This photo was taken some time after a:(A)volcanic eruption(B)hurricane(C)landslide(D)bush fire
3. The three images are related in that they all show the effects of:(A)deforestation and soil erosion(B)earthquakes(C)melting permafrost(D)rainfall and landslides
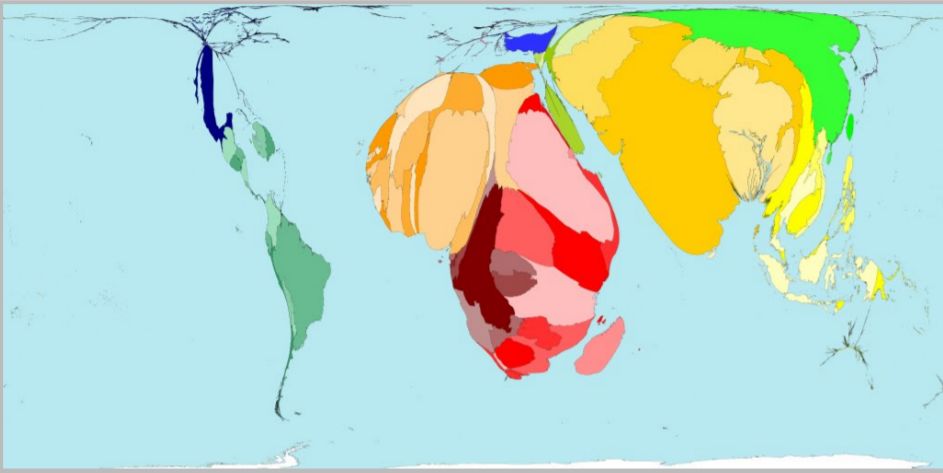
4. This world map shows the geographical distribution of:(A)child labour(B)pollution by cars(C)deforestation(D)emigration
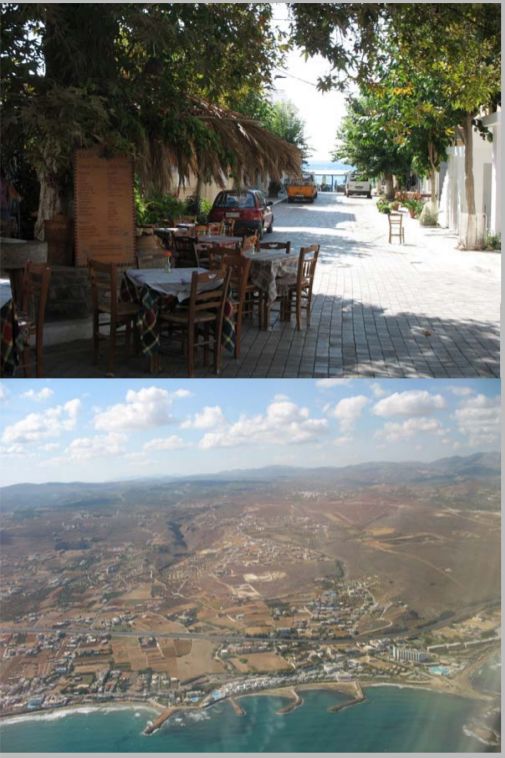
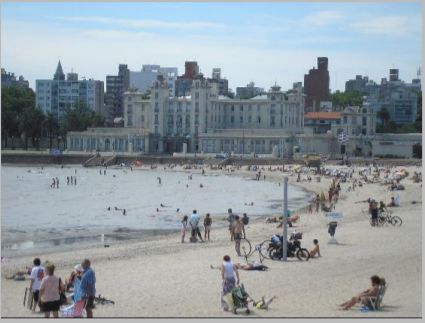
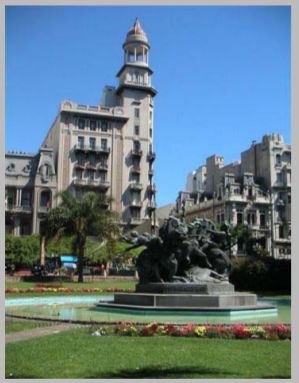
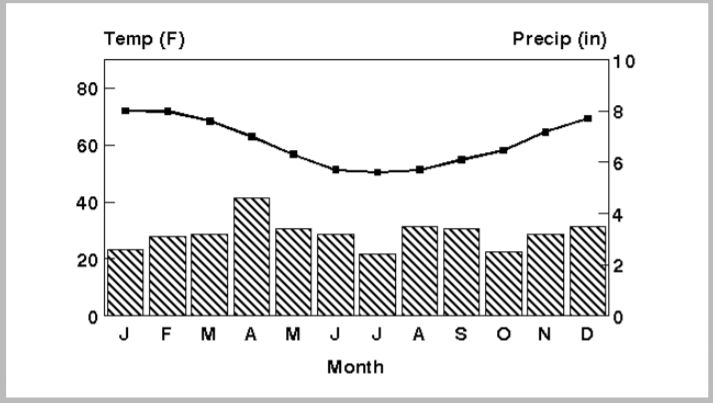
5. These two images and the climate graph relate to the same city. They are of which city?(A)San Diego(B)Vancouver(C)Lima(D)Montevideo
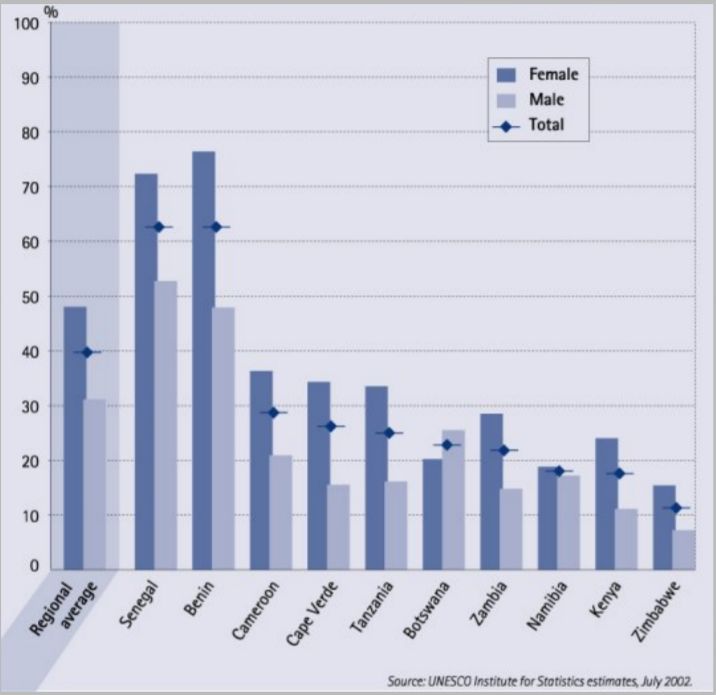
6. The USA has 7 million people with the same characteristic as that shown in this graph of some African countries. The graph shows:(A)criminality(B)illiteracy(C)agricultural workers(D)infant mortality
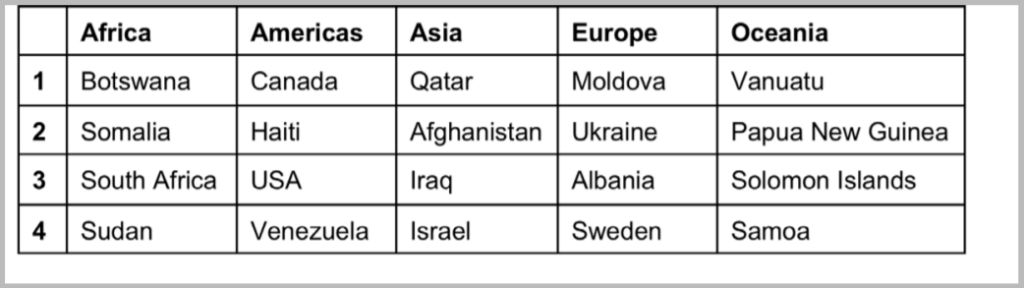
7. Which row gives the country perceived as the most corrupt in its region, according to Transparency International?(A)Row 1(B)Row 2(C)Row 3(D)Row 4
Table 1. Perceived Corruption (2007, based on an analysis of 13 surveys) Source: Transparency International
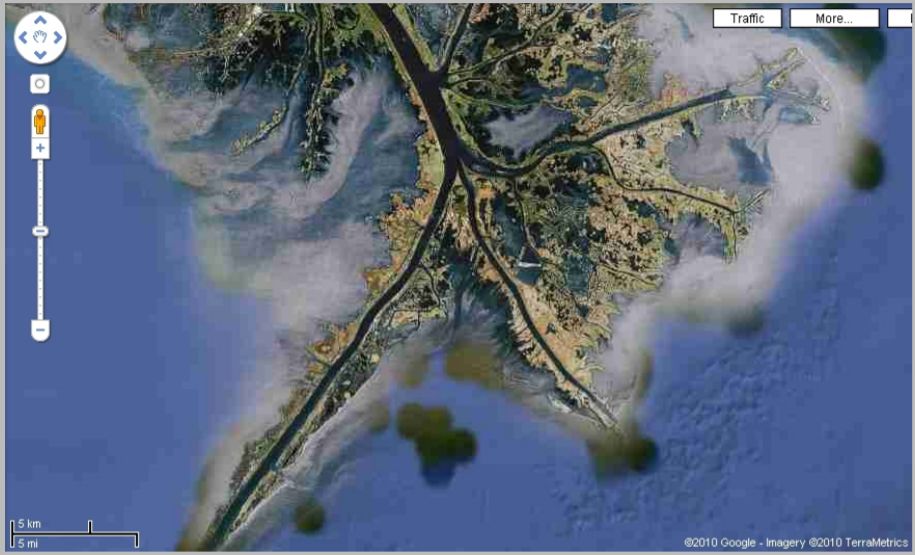
8. This landform is the result of:(A)deposition(B)refraction(C)longshore drift(D)sea level rise
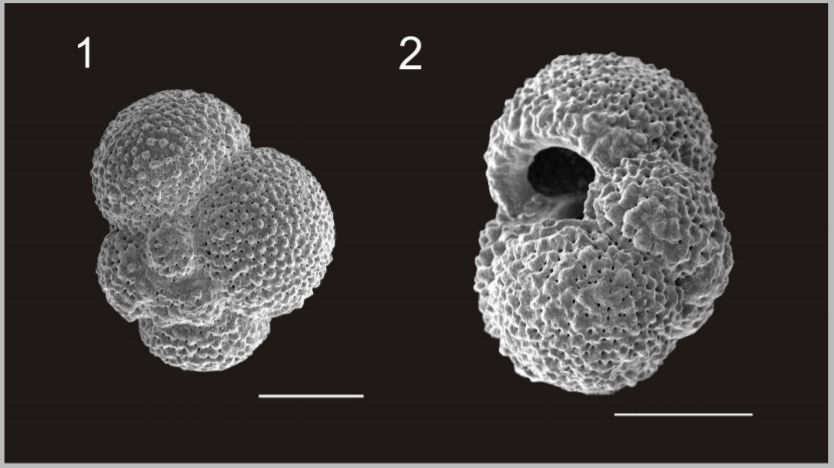
9. Foraminifer are tiny animals that are important in the food chain. The shells of foraminifer in the Southern Ocean have reduced in weight by about 30% since pre-industrial times. What has caused this?(A)changes in diet(C)evolution(B)sea level rise(D)ocean acidification
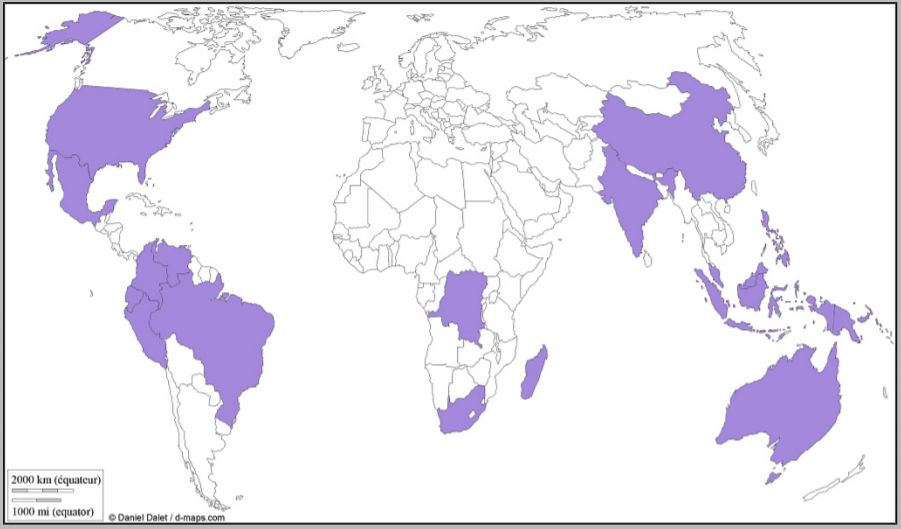
10. The distribution shown on the map is of countries with:(A)high levels of biodiversity(C)high levels of coal production(B)low levels of urbanisation(D)low levels of water stress
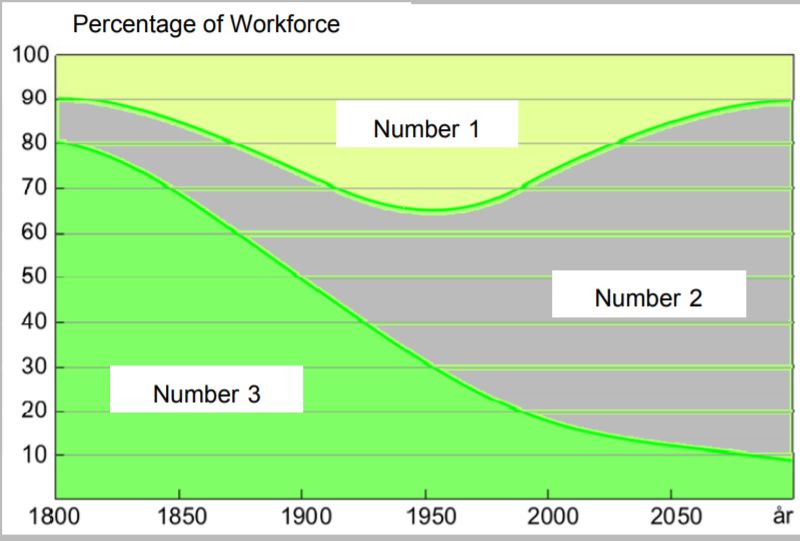
11. This diagram shows the size of workforce sectors in the Western World, as classified using the three-sector hypothesis. Which sector is labelled by which number?(A)1-primary, 2-secondary, 3-tertiary(B)1-secondary, 2-tertiary, 3-primary(C)1-tertiary, 2-primary, 3-secondary(D)1-secondary, 2-primary, 3-tertiary
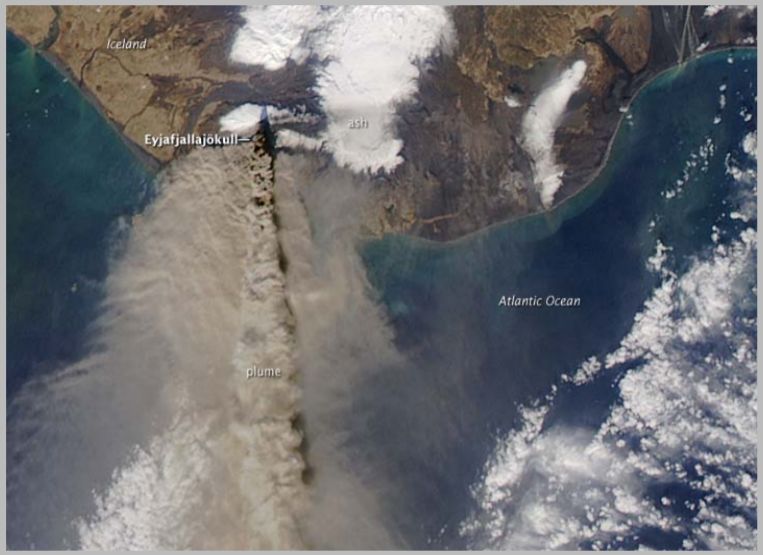
12. The image shows the plume from the volcano near Eyjafjallajokull in Iceland. This particular volcanic activity is due to the fact that Iceland is:(A)on a hot spot(B)on the Mid Atlantic Ridge(C)on a destructive plate edge(D)near the Arctic Circle
Volcanic Eruption
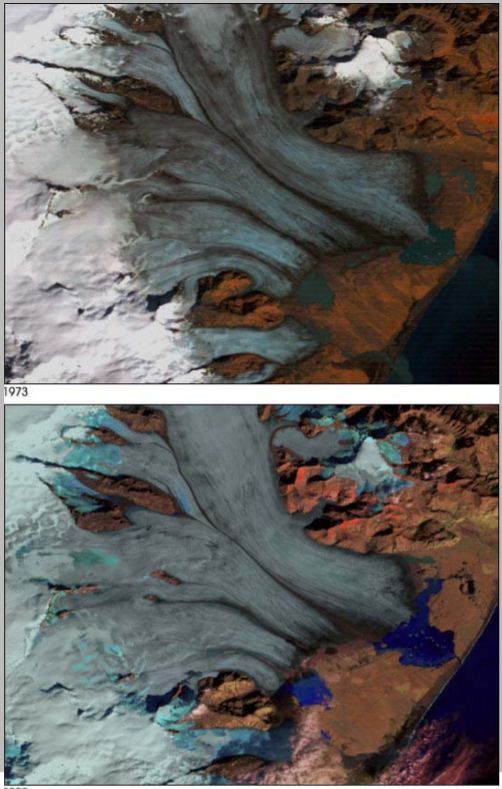
13. Which of the following statements explains glacier retreat most accurately?(A)A warmer climate raises the albedo of the ice, thus melting the ice.(B)A warmer climate melts the ice, thus lowering the overall albedo, reinforcing the melting process.(C)Global warming causes more precipitation, thus causing the glaciers to retreat.(D)Global warming causes less precipitation, thus causing the glaciers to retreat.
Retreating glaciers
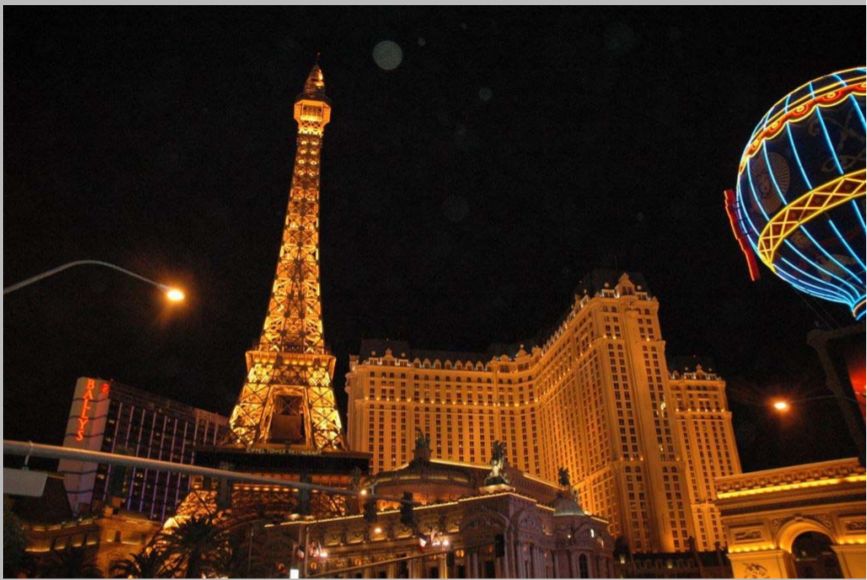
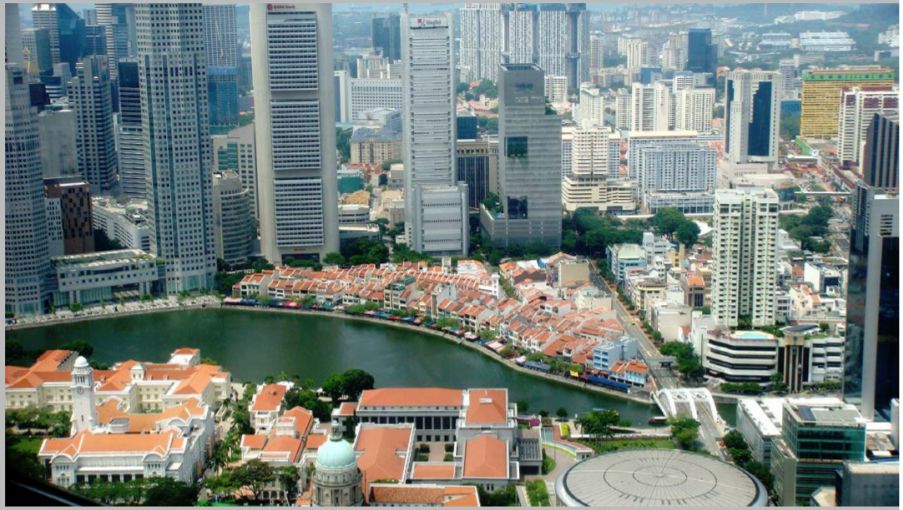
14. Look carefully at the photo. The services sector of this city mainly caters for:(A)tourism(B)finances(C)trade(D)politics
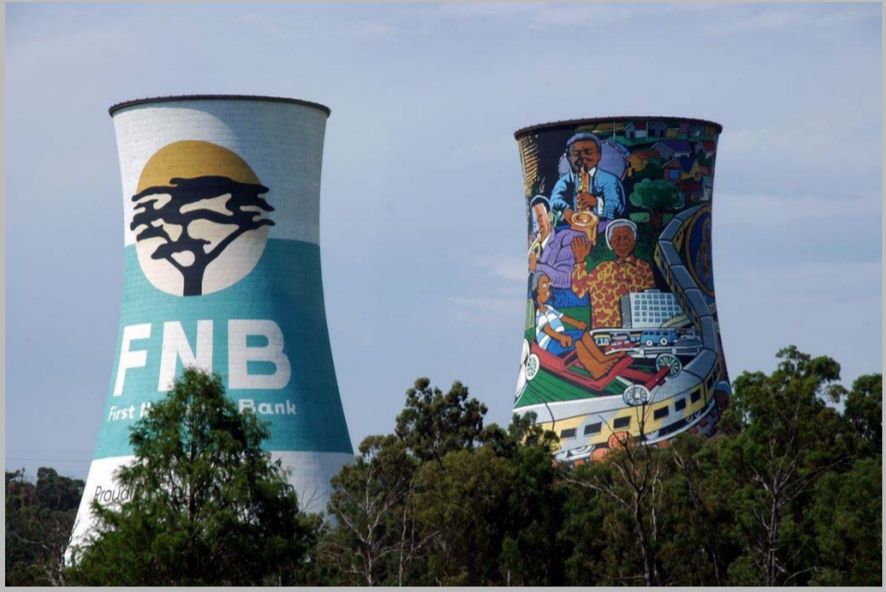
15. Where was this photo taken?(A)South Africa(B)Germany(C)Brazil(D)New Zealand
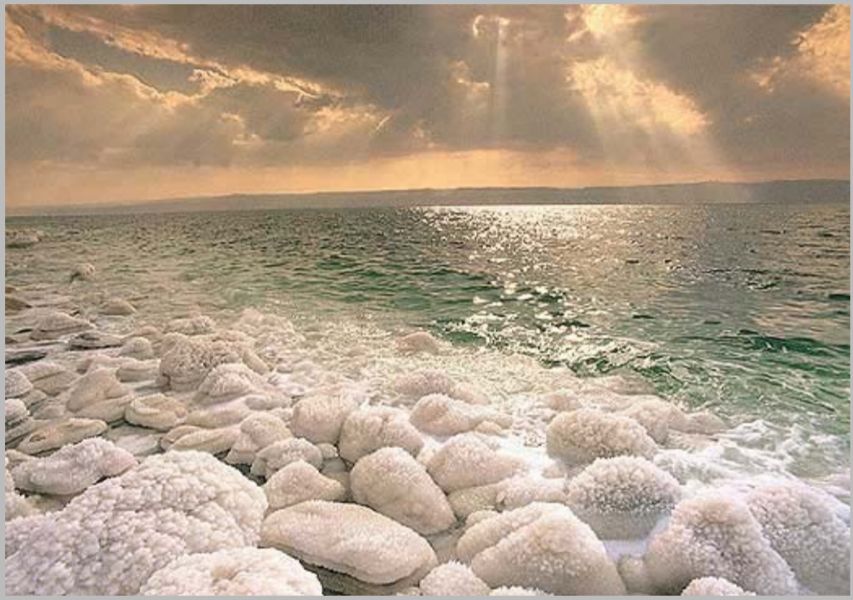
16. In which midlatitude region is this landscape located?(A)Atacama Desert(B)Barents Sea(C)Dead Sea(D)Nam-Tso Lake
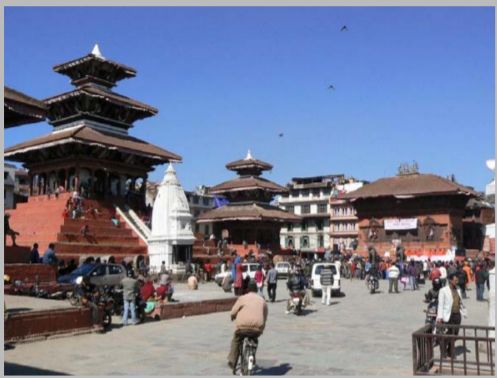
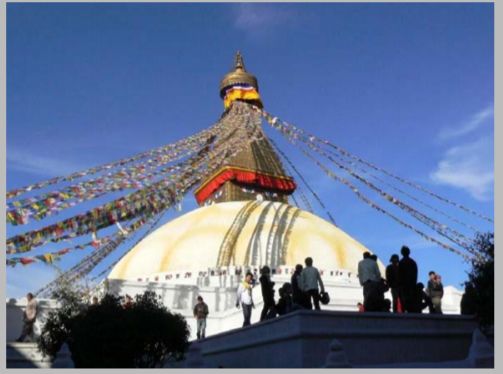
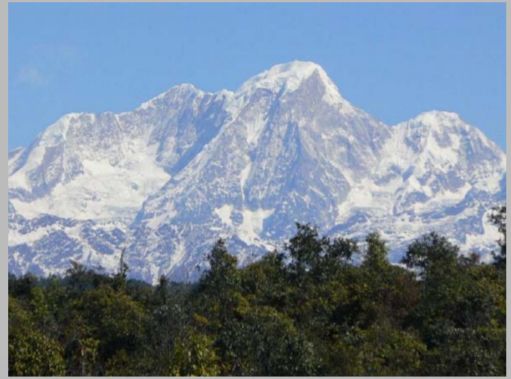
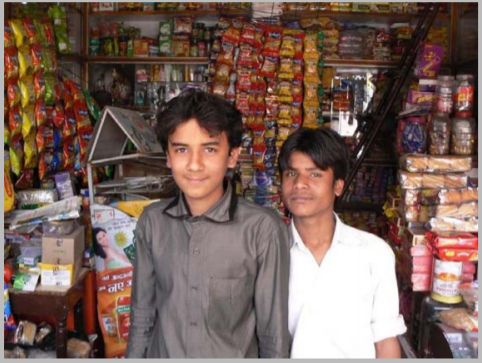
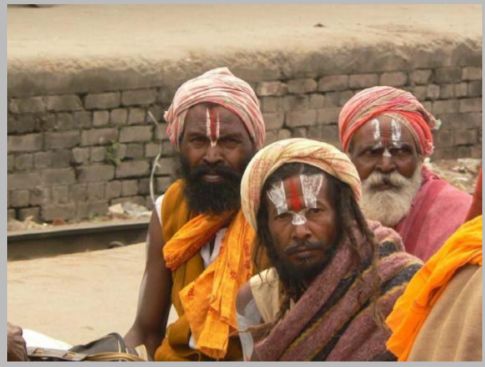
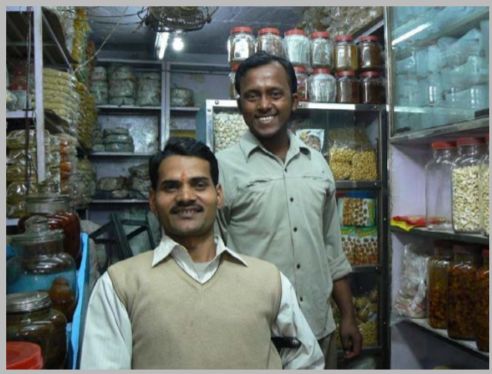
17. These three photographs were all taken in the same country. Look carefully. In which country were they taken?(A)Bolivia(B)Myanmar(C)Switzerland(D)Nepal
18. Here are three photographs. Despite language, religious and cultural differences, these people belong to the same racial group. Which racial group is it?(A)caucasian race(B)mongoloid race(C)negroid race(D)mixed race
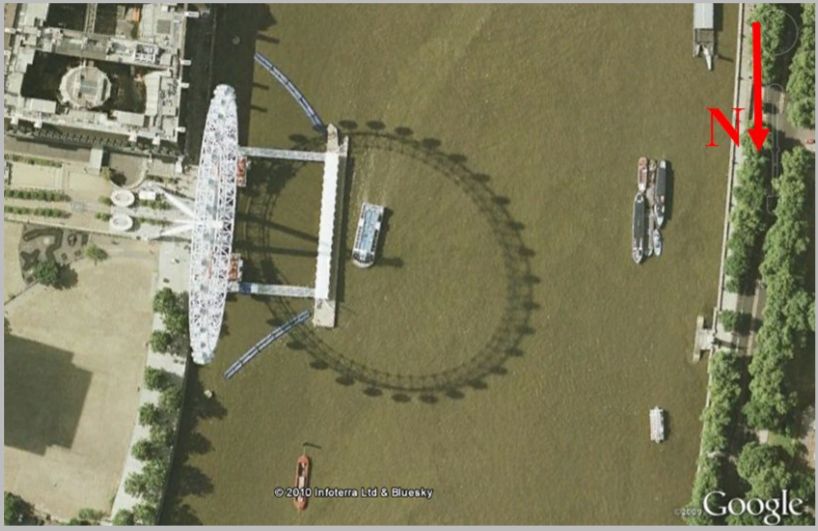
20. This photo of the London Eye was taken on 9 September 1999. In which part of the day was the photo taken?(A)morning(B)noon(C)afternoon(D)late evening
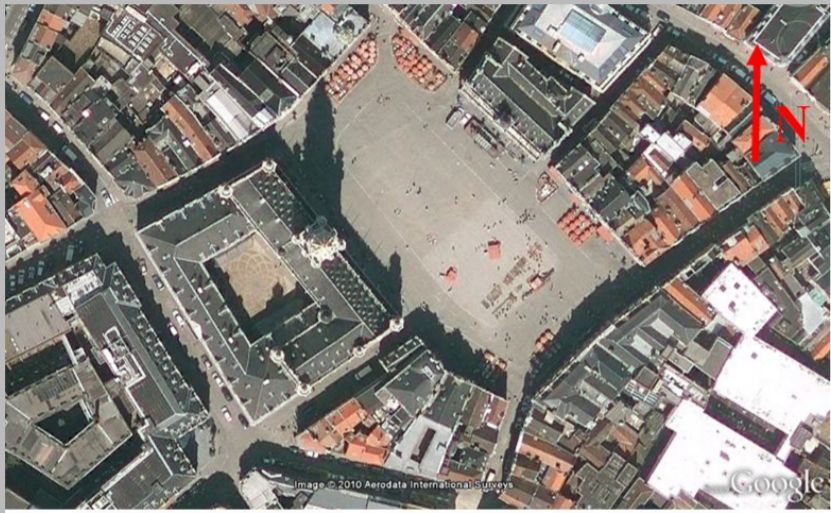
21. This is a photo of the Grand Place in Brussels, Belgium. It is located at 50° 50’N, 4° 21’E. The photo was taken on 8 June 2004 exactly at solar noon. What was the official time in Brussels when the photo was taken?Hint: Belgium is in GMT+1 time zone. Remember that the photo was taken in summer.(A)11.18(B)12.18(C)12.42(D)13.42
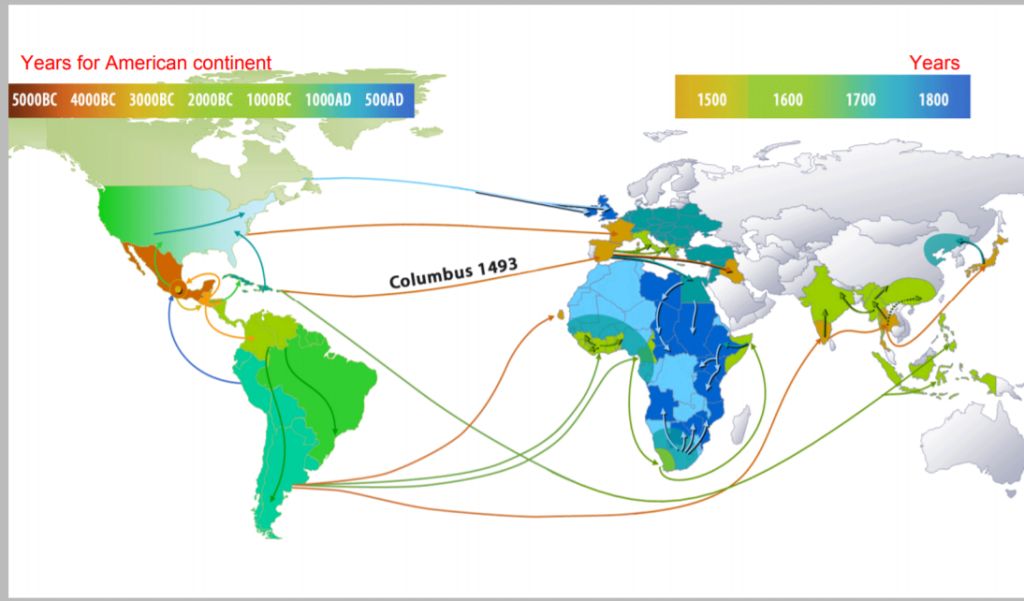
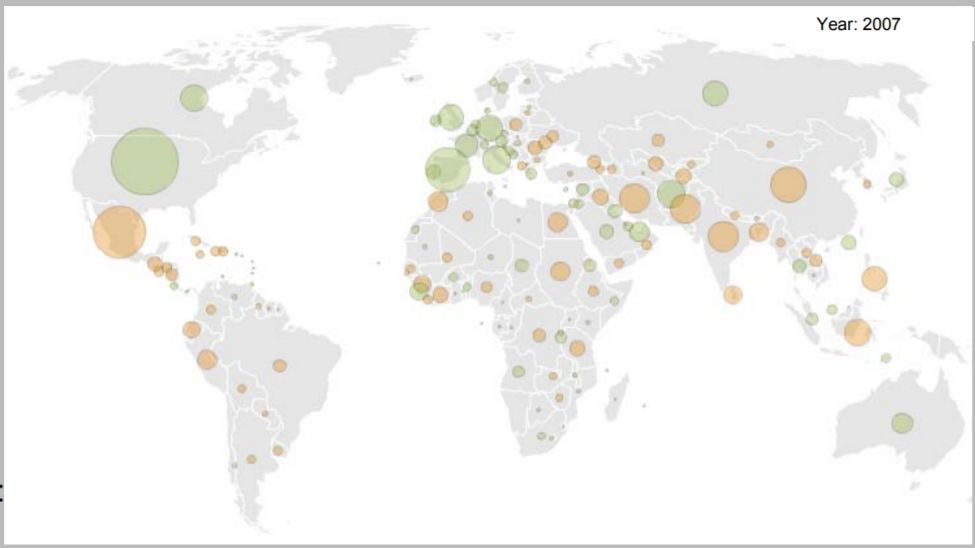
22. This map shows the flow of(A)maize / corn(C)gold(B)population(D)birds
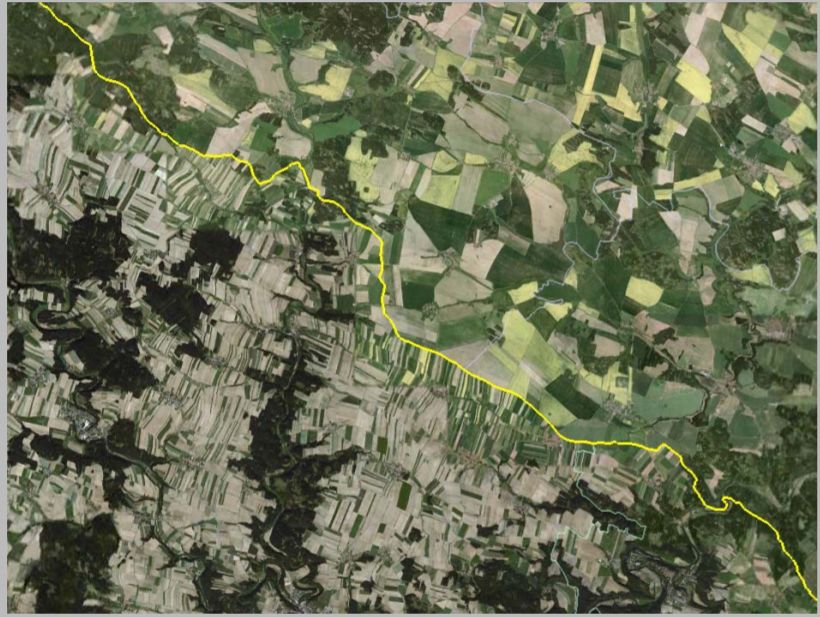
24. The yellow line on the image distinguishes between:(A)sizes of households(B)vegetation types(C)effects of a flash-flood(D)states
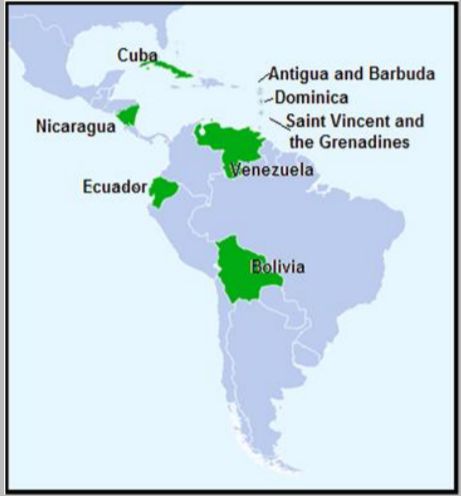
25. The alliance illustrated here was established by the leaders of two Latin American countries in 2004. What is the proposed common currency unit for this alliance?(A)bolivar(C)peso(B)Caribbean dollar(D)sucre
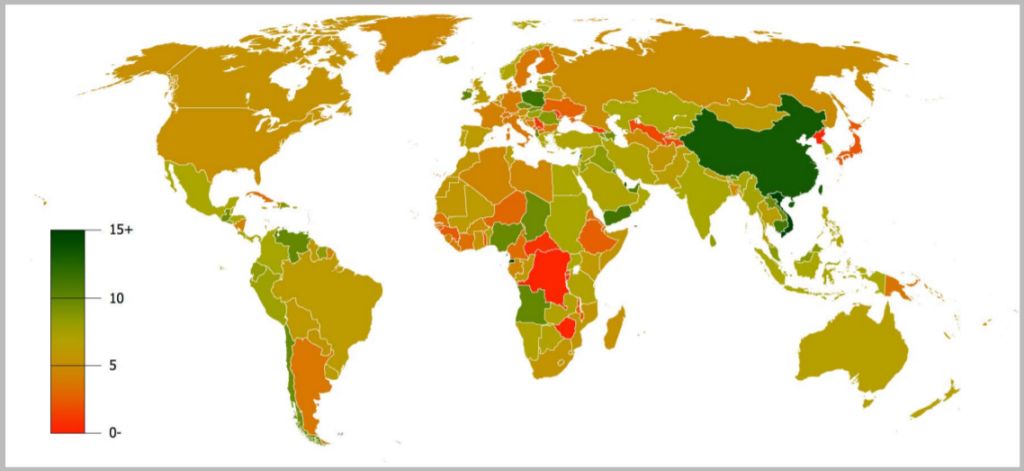
26. This map shows the data by country for:(A)GDP growth 1990–2007(B)GDP per capita in 2009(C)employment in agriculture in 2009(D)population density in 2009
27. Look carefully at the photo and name the country in which it was taken.(A)Gambia(B)New Zealand(C)Argentina(D)Costa Rica
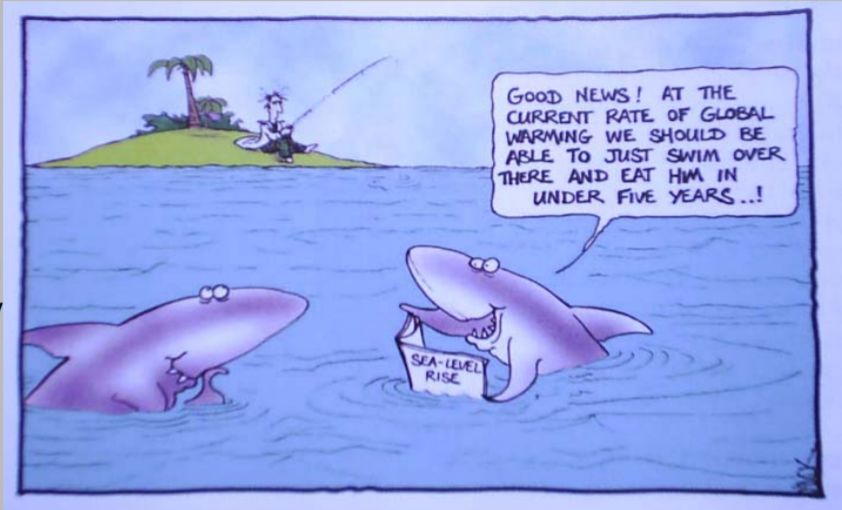
28. Most of the world's coastal cities were established during the last few millennia, a period when global sea level has been near constant. Since the mid-19th century, sea level has been rising, most likely as a result of human induced climate change. During the 20th century, sea level rose by roughly:(A)1.5 to 2.0 mm/year(B)1.5 to 2.0 cm/year(C)10 cm/year(D)50 cm/year
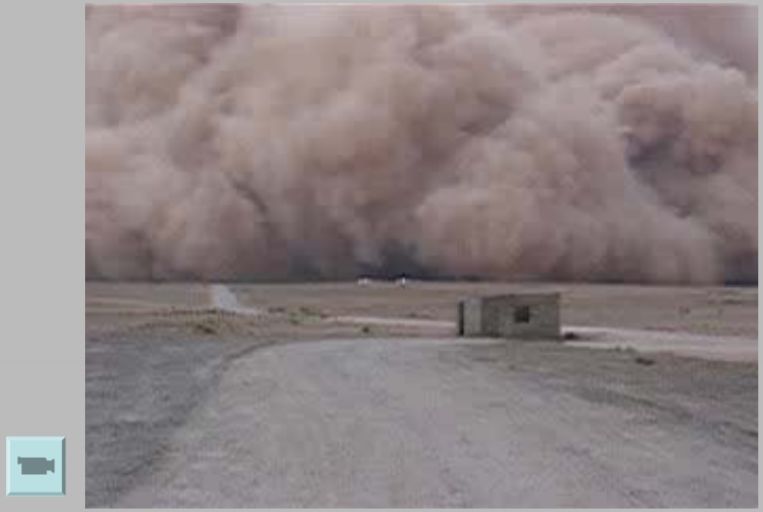
29. In which country does this natural phenomenon occur?(A)Greece(B)Albania(C)Iraq(D)Bangladesh
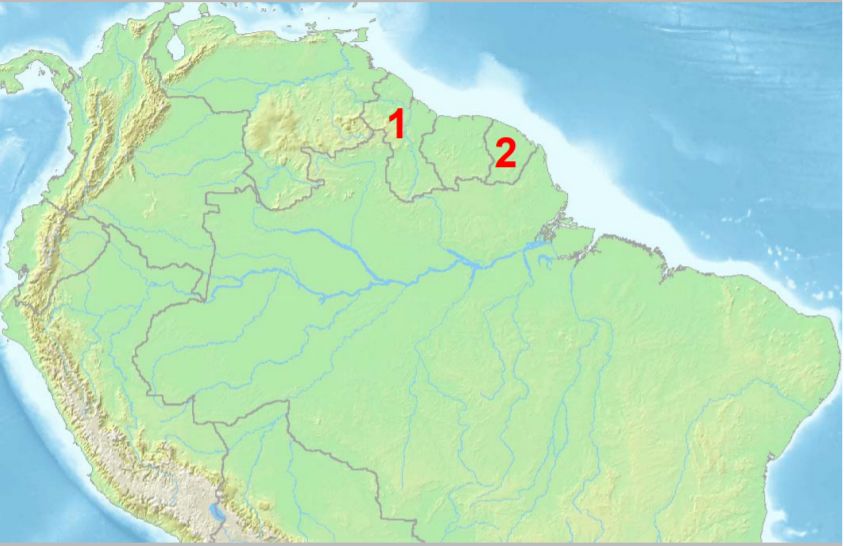
30. Country 1 and 2 have different official languages. Which language is labelled by which number?(A)1-Dutch, 2-Spanish(B)1-English, 2- French(C)1- French, 2-Spanish(D)1-French, 2-Dutch
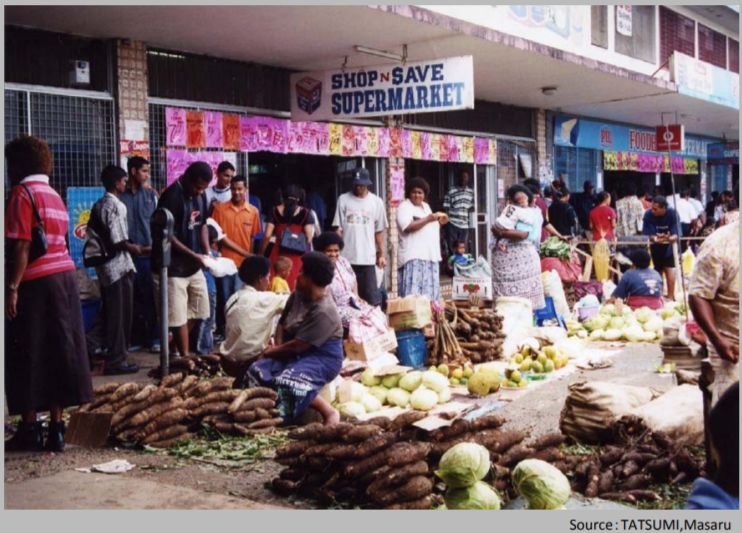
31. In which country was this photo taken?(A)Bolivia(B)Fiji(C)Tunisia(D)Mongolia
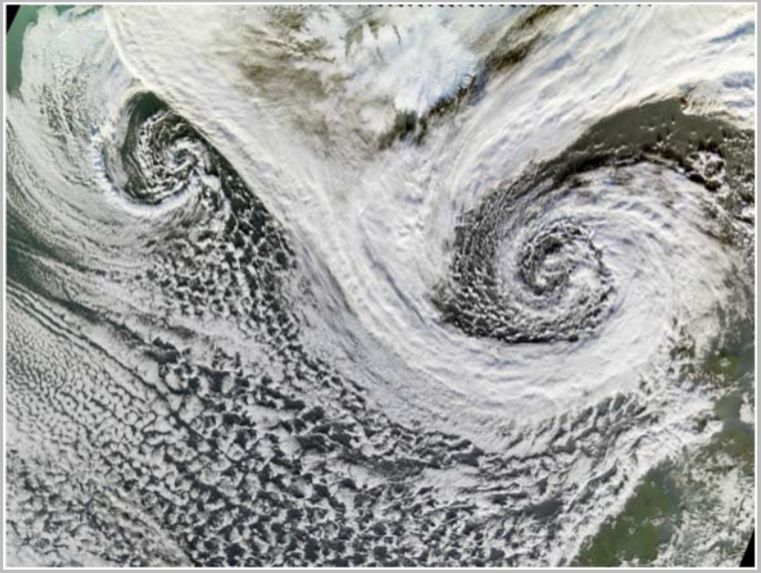
32. Look carefully. This satellite image represents:(A)cyclones in the South Pacific(B)anticyclones in the North Atlantic(C)cyclones in the North Atlantic(D)anticyclones in the South Pacific
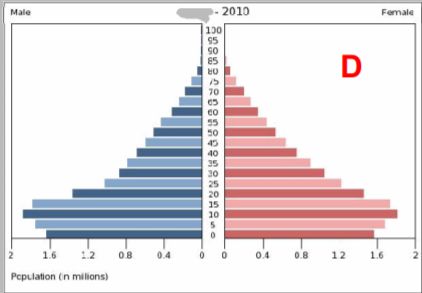
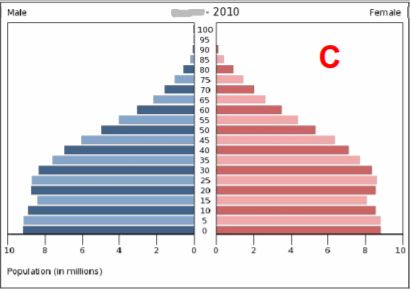
33. The diagram on the left shows the Demographic Transition Model. Which population pyramid – identified by letters A to D – is typical of Stage 2?(A)(B)(C)(D)
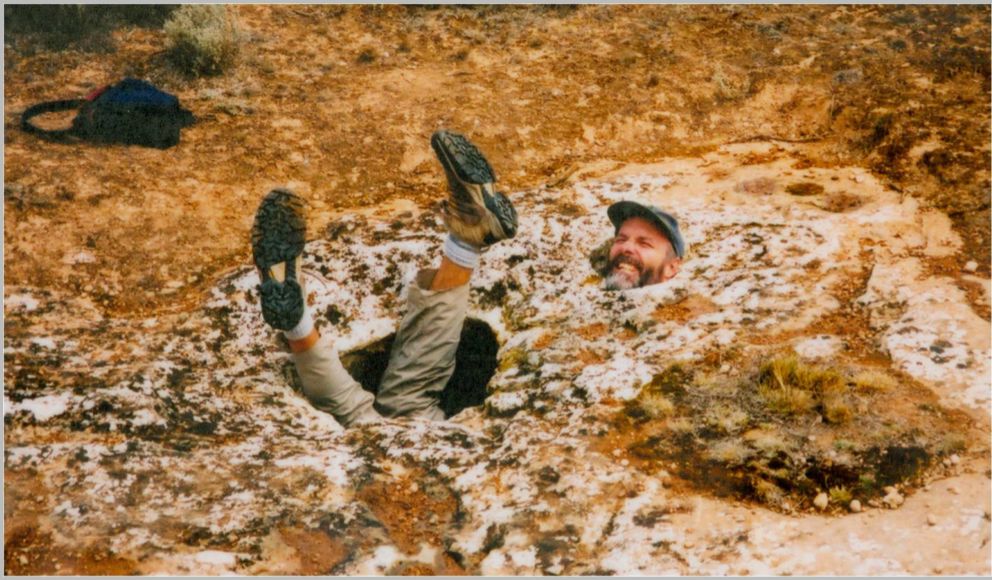
34. This photo shows a physical geographer (or two!) trapped in rock holes. In which type of rock does this kind of landform usually develop?(A)sandstone(B)limestone(C)granite(D)basalt
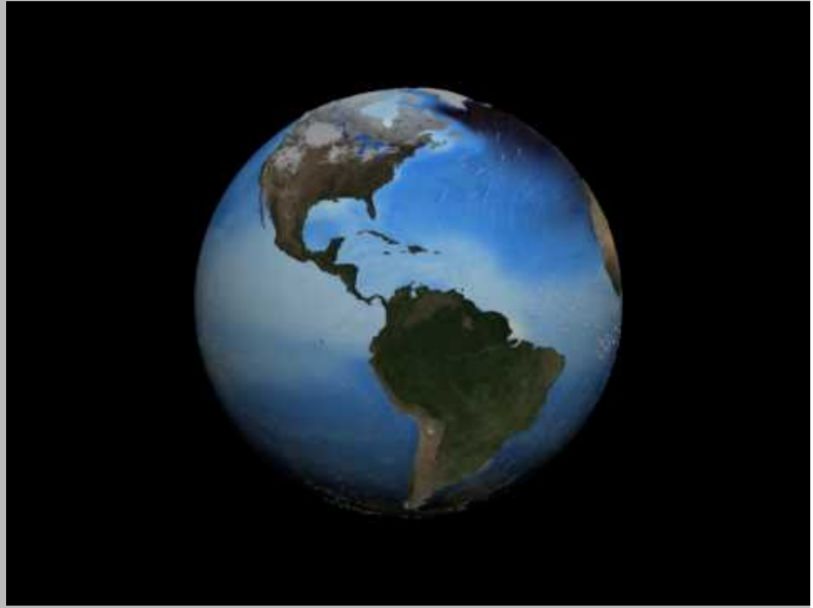
35. What does this film show?(A)annual migration of Orca whales(B)ocean surface currents(C)thermo-haline circulation(D)major global wind systems
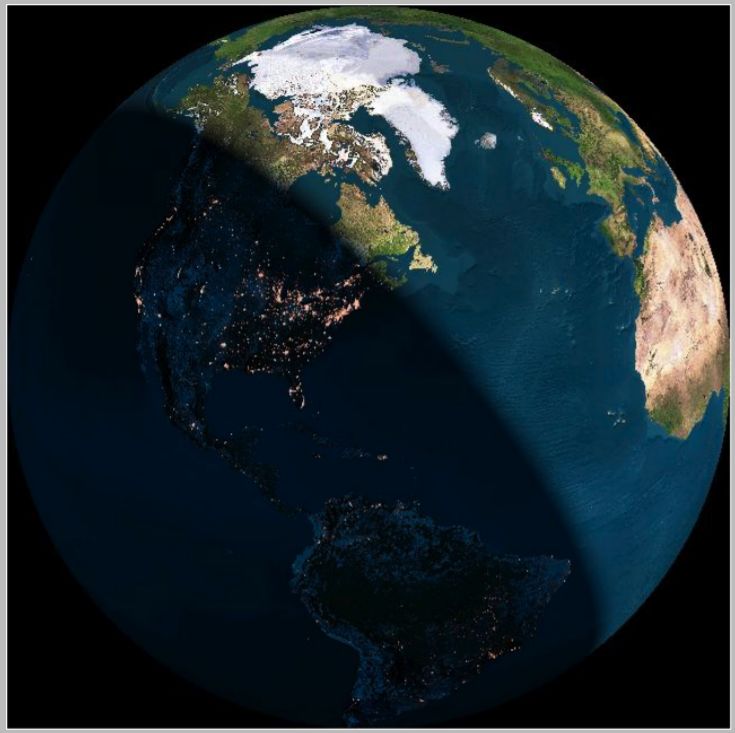
36. For the inhabitants of Quebec, when this image was taken it was a:(A)summer morning(B)autumn afternoon(C)winter morning(D)spring afternoon
37. Only one country (Congo Dem. Rep.) among the 5 shown does not follow the typical development path. What is the main reason for this?(A)natural disaster(B)global warming(C)corruption(D)civil war
38. What is the immediate cause of the phenomenon you can see in this movie?(A)global warming(B)leaking gas pipelines(C)methane bubbles in the ice(D)gelifluction
39. What do we call this phenomenon?(A)mud flow(B)landslide(C)creep(D)solifluction
40. This is a typical example of:(A)a strato volcano erupting(B)the formation of a caldera(C)a shield volcano erupting(D)pyroclastic clouds
 阿摩線上測驗
登入




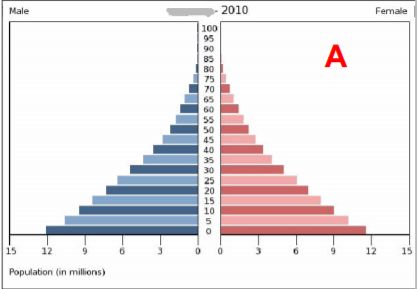 (B)
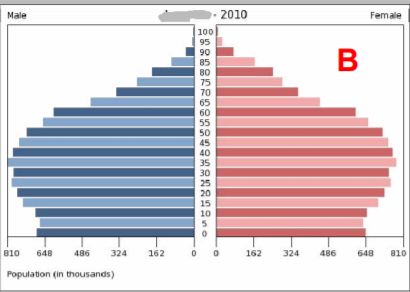 (C)
 (D)