 阿摩線上測驗
21. Figure 2 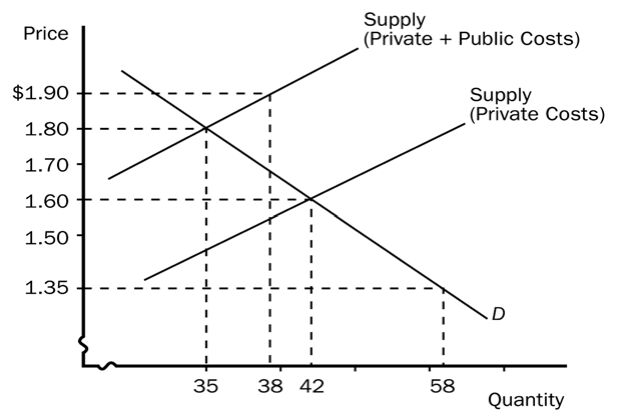
Refer to Figure 2. This graph represents the tobacco industry. The industry creates
(A) positive externalities.
(B) negative externalities.
(C) no externalities.
(D) no equilibrium in the market.
答案:登入後查看
統計: 尚無統計資料
統計: 尚無統計資料