 阿摩線上測驗
題組內容
4. (15%, 5% each) A candy bar manufacturer is trying to estimate how sales are influenced by flavors and the price of their products. To do this, the company randomly chose some stores and sold their candy bar of different flavors at different prices. Using candy bar sales as the dependent variable, the company conducted a regression analysis. The three flavors of candy bars are banana, apple and peach. The coding and the regression results are as follows:
$$X1 = \begin{cases} 1 & \text{if flavor is banana} \\ 0 & \text{otherwise} \end{cases} \quad X2 = \begin{cases} 1 & \text{if flavor is apple} \\ 0 & \text{otherwise} \end{cases}$$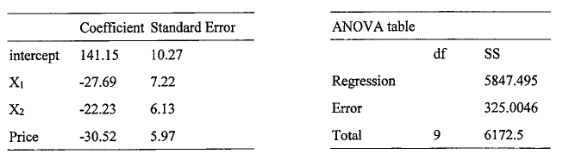
(a) What percentage of the total variation in candy bar sales is explained by price and flavors together?