 阿摩線上測驗
題組內容
2. (10%, 5% each) A study compares sales based on different magazine layouts, and three layouts are designated as A, B, and C. The sales data were collected for 5 days and summarized as follows: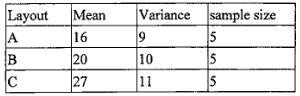
The Sum of square between layouts is 223.33, and the sum of square total is 403.33.
(b) What is the test statistics for testing the null hypothesis that the mean sales are equal for three layouts?