 阿摩線上測驗
26. Choose the correct statement about the diagram below.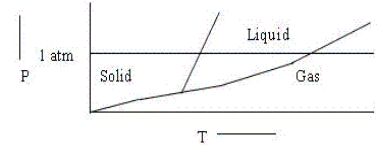
(A) The diagram is qualitativelycorrect for water.
(B) The diagram shows that the melting point of the solid increases withincreasing pressure.
(C) The diagram shows the triple point above 1 atm pressure.
(D) The diagram could represent the phase diagram of CO2.
(E) None of the above statements is correct.
答案:登入後查看
統計: 尚無統計資料
統計: 尚無統計資料